Analytics is about deriving insights from data and building models to enable decision making. Depending on the type of data handled, it is referred to by different names Eg. Human Resource Analytics, Sensor Analytics, Social Media Analytics and so on.

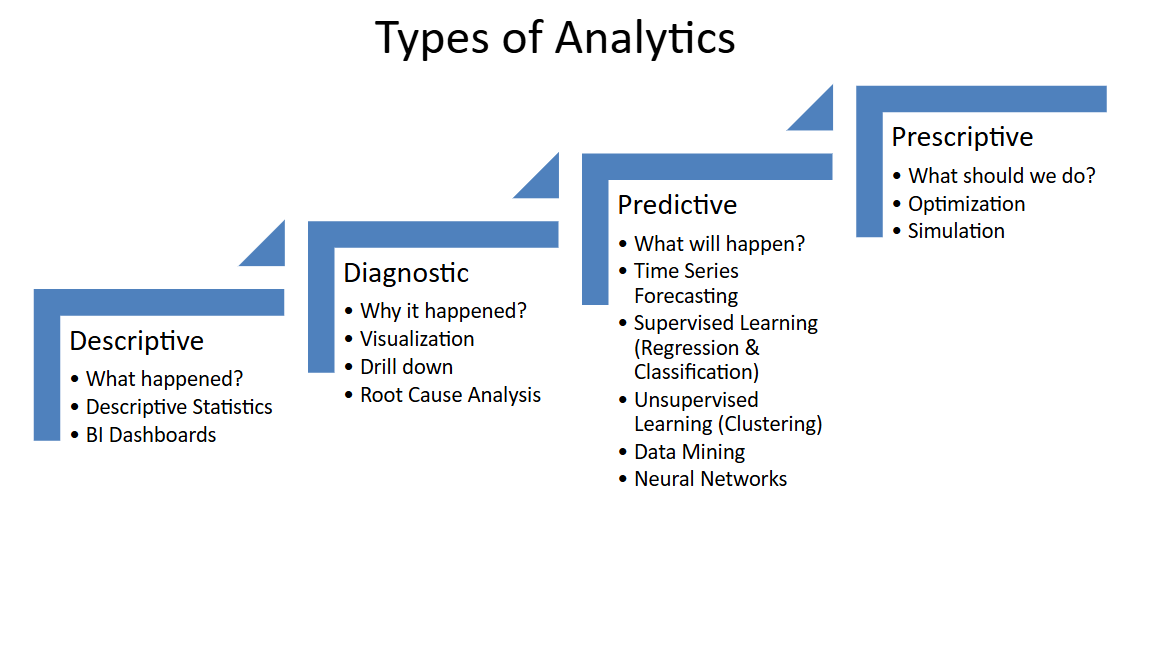
The classification of analytics into four types based on the purpose of the data processing and nature of insights drawn is shown below.
Tools: A variety of tools are available for the processing involved in Analytics. Typical tools used are Spreadsheets (Eg. Microsoft Excel), Business Intelligence Dashboard tools (Eg. Microsoft PowerBI, Tableau etc.), Off-the-shelf Analytic Software (Eg. SPSS, Orange etc.), and Programming Tools (Eg. VisualBasic, R, Python etc).
Illustrations
Analytics is best learnt by application of techniques implemented on specific decision scenarios (in a specific industry) using specific tools. In the following sections, analytic techniques applied to specific decision scenarios are illustrated through MS-Excel, R, and Python.
Insights and Decisions through Data Visualizations
Decision Scenario 1
You are an analyst tasked with creating dashboard templates for the annual performance review by the CEO. What would be the visualization that you will propose for the following?
The annual target for the organization is to deliver an average training of 5 days to its employees. The CEO needs to get a comprehensive view of the training performance of the organization and make informed decisions.
Discussion
Discussion notes go here…
Decision Scenario
You are an analyst tasked with creating dashboard templates for the annual performance review by the CEO. What would be the visualization that you will propose for the following?
The organization executes software development projects of three categories in terms of complexity. 150 projects were executed during the previous year in total. Each had a productivity target. The organization has a benchmark productivity target for each category of the projects. The dashboard should enable the review and decisions of the following:
a. Target setting of the projects in the previous year
b. Actual performance of all projects against their respective targets in the previous year
Decision Scenario
You are an analyst tasked with creating dashboard templates for the weekly performance review by the CEO. What would be the visualization that you will propose for the following?
The organization works on projects with a variety of skill requirements. Each project will require a certain number of people with certain proficiency levels in specific skills. The employees are assessed on each of their skills and a proficiency rating is available for each of the skills that they are proficient in.
Assume: 1000 employees. 10 skills (S1, S2, … S10). 3 Proficiency Levels (1-Beginner,2-Advanced,3-Expert)
CEO should be able to get an idea of the skill gaps in the organization/projects and take decisions.
Insights and Decisions through Data Benchmarking
Decision Scenario
In an IT services organization, the software development productivity is measured as Function_Points_Delivered/Effort_Spent. The unit used is FP/PM where FP denotes Number of function points delivered by the team and PM denotes the effort in Person-months.
The organization has a benchmark in terms of five point summary as below. This was computed using data from 120 projects executed in the last year.
Productivity (FP/PM) : Min – 3; Q1 – 6; Q2 – 12; Q3 – 17; Max – 20
- What will be a good target for the next year for the project teams? Why?
- Think from the perspective of the Global Delivery Head, whose objective is to bring down costs without compromising quality so that overall company profitability is higher.
- Thinking from the Program manager – representing various project teams – perspective, what will be your approach to this?
Decision making with Statistical Models
Image and Video Analytics
This section is under development. It will cover various analytic techniques used with image and video data for addressing business usecase scenarios or technology product features.
Evaluation of Machine Learning Models
ML models need to be evaluated and fine tuned till they meet the requirements of the stakeholders. This section summarizes the methods for this.
